License Monitor

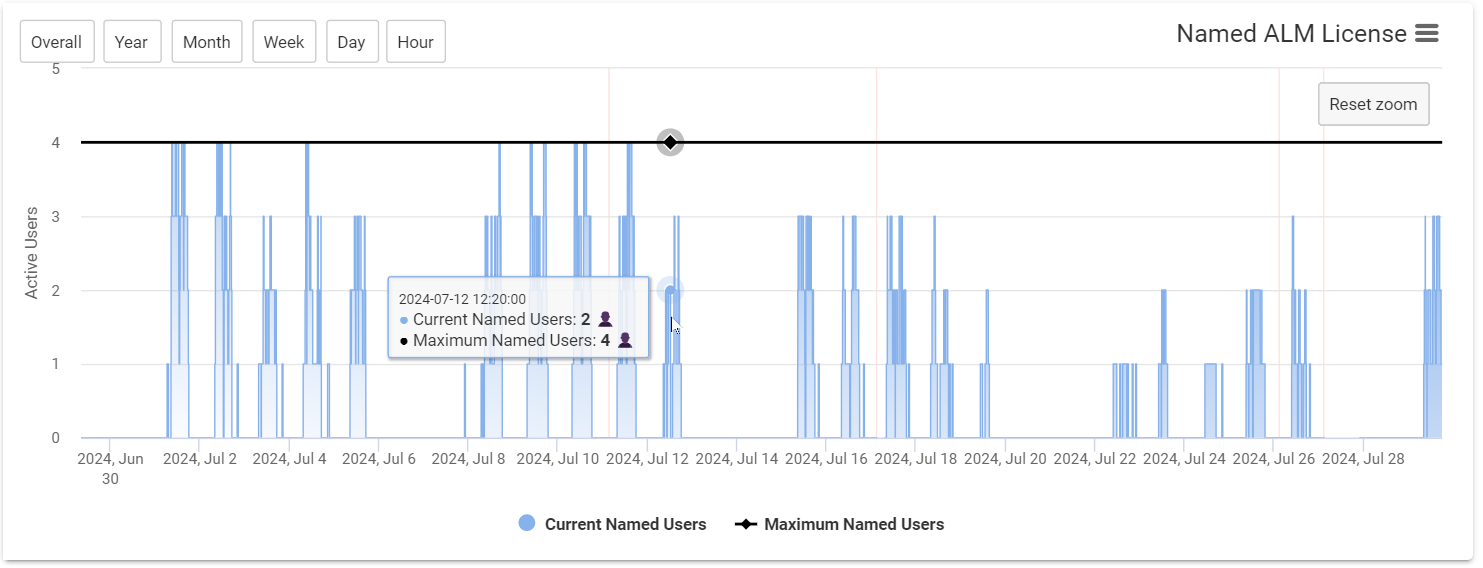
For each license type (ALM, QA, REQ, ...) and license category (named, concurrent) the capacity utilization of Polarion licenses is displayed in a graph over the period from the License Monitor going live until today. The scaling of each graph can be zoomed to the hour and the view can be adjusted to any time interval. Each graph can be printed out or downloaded as a PNG, JPG, PDF or SVG file.

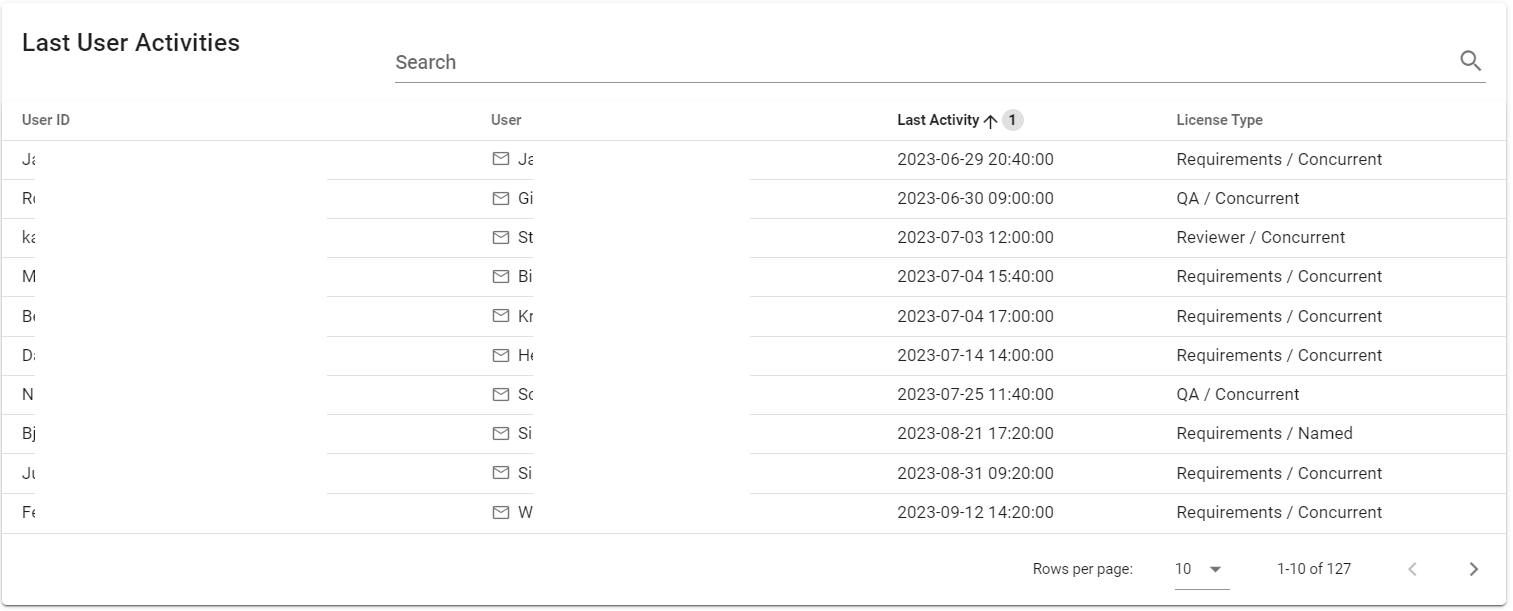
All users who have been assigned a Polarion license and who have been active in Polarion at least once are named in a list, together with the last time they were active in Polarion and the Polarion license assigned to them.

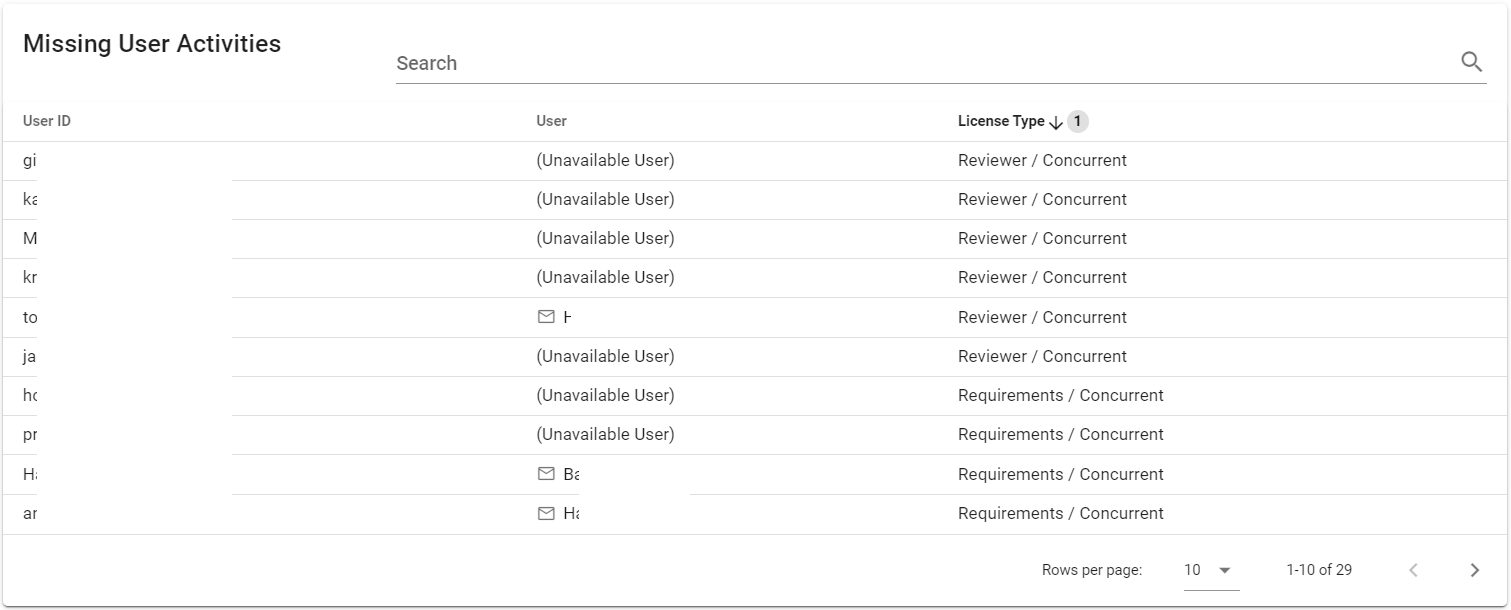
All users who have been assigned a Polarion license and who have never been active in Polarion before are named in a list, each together with the Polarion license that is assigned to him or her.


